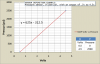
The cooefficients are taken from the equation that describes the curve (or linear slope, in this case) that you generate for the sensor using the tool of your choice. In this case, excel is a really good tool. If you graph
|.5 | 4.5 |
|0 | 2500
(those are four cells)
then have it pull out the equation, the equation that describes this sensor is Y = 625X - 312.5, where X is voltage and Y is pressure.
So X0 is -312.5 and X1 is 625.
Now, remember your original statement: .5V is 0 PSI. The sensor page is indicating that it is seeing .3825V, which is below that. So your sensor has yet to come off the bottom peg. This might just be an accuracy at the low end thing (we struggle with this with very low pressure fuel pressure readings, because the sensors don't track very well at the low end, as some of you may know), or it could be that the .5-4.5V spread that you indicated isn't a very good characterization of the sensor.
FYI, when we characterize a sensor, we nominally run it up and down the temp/pressure range, usually on multiple sensors to confirm that the sensor type even has a repeatable voltage curve that can be trusted. This usually creates a nice curvy line, which can then be approximated with a full 4th order polynomial.